HomeAboutServices All Projects — BI & Analytics — Web Development — YouTube Contact Get a Quote →
BI & Analytics

Business Intelligence Projects

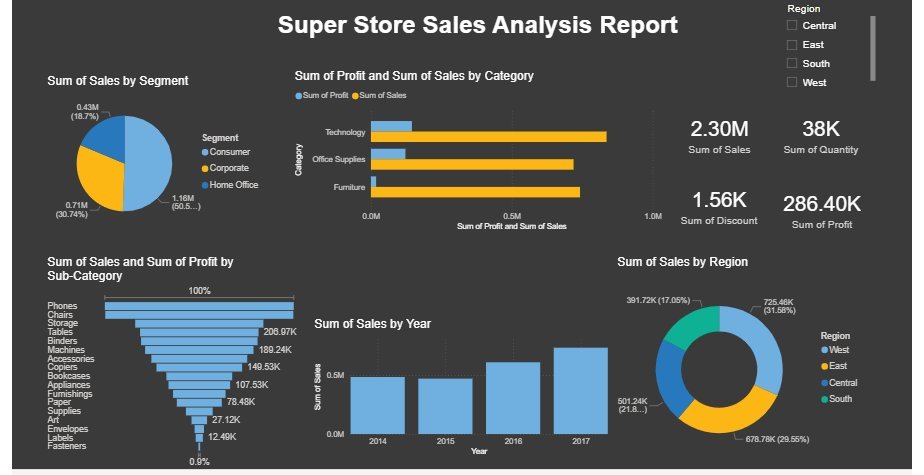
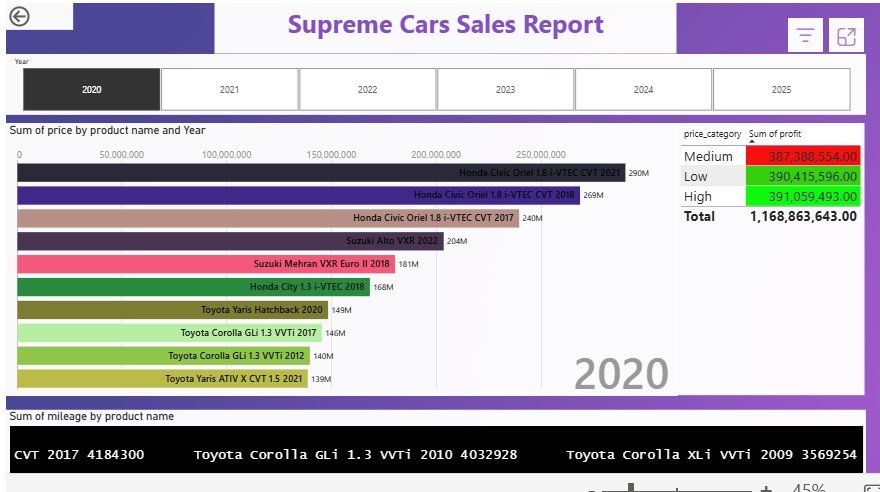
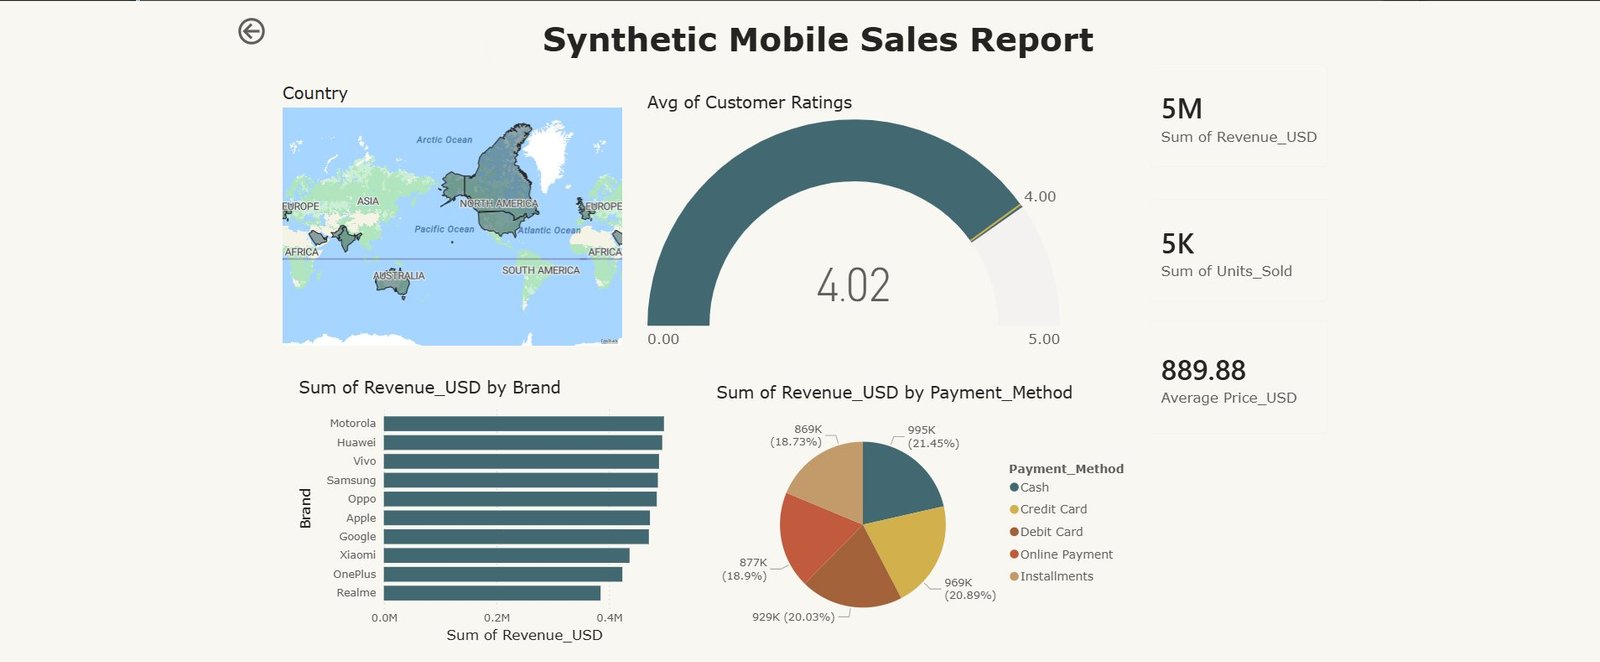
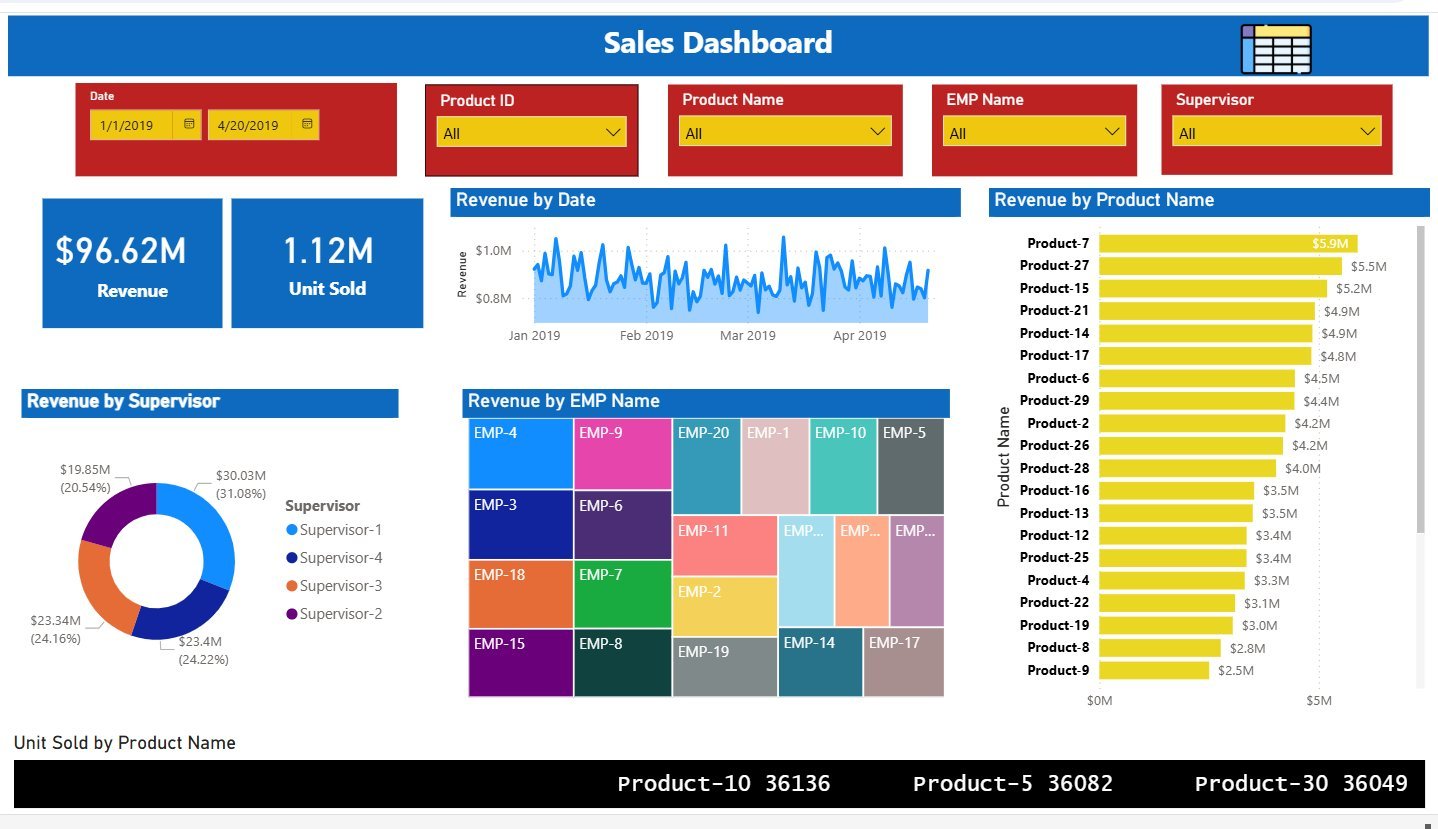
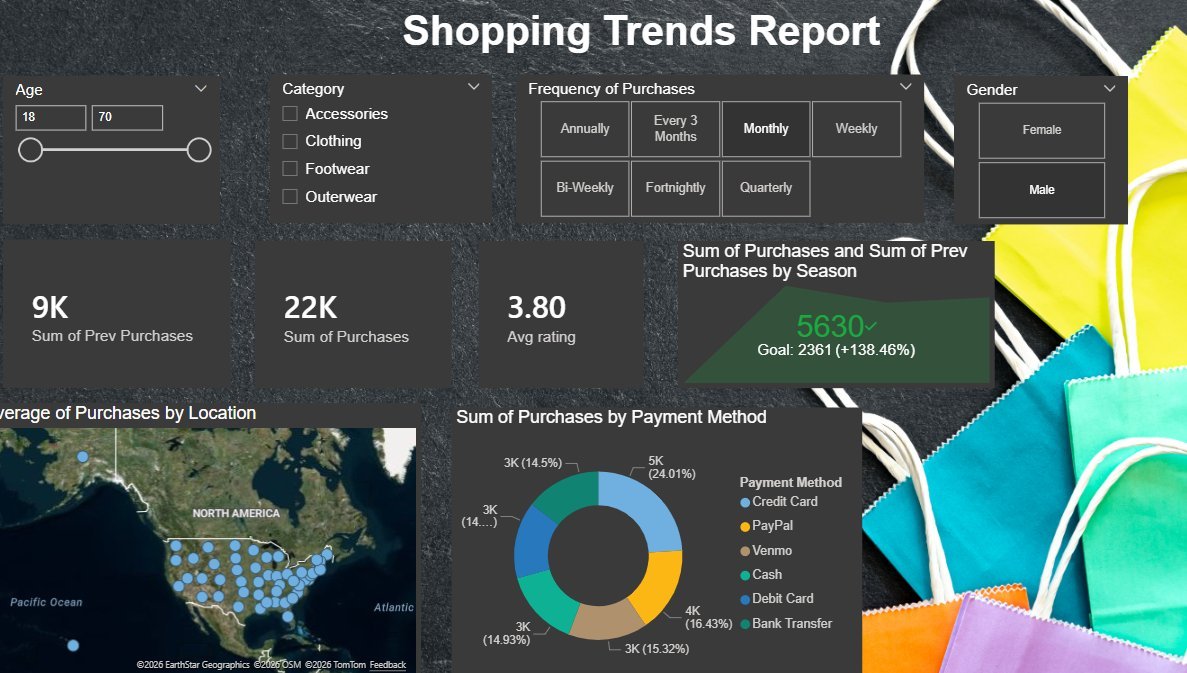
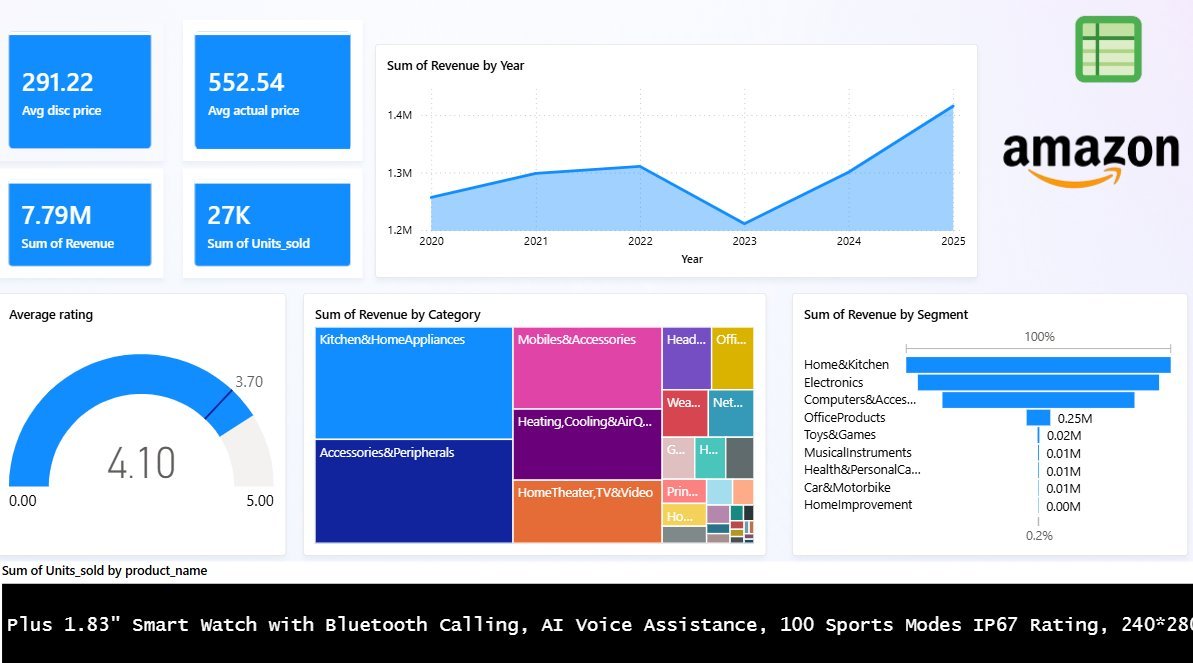
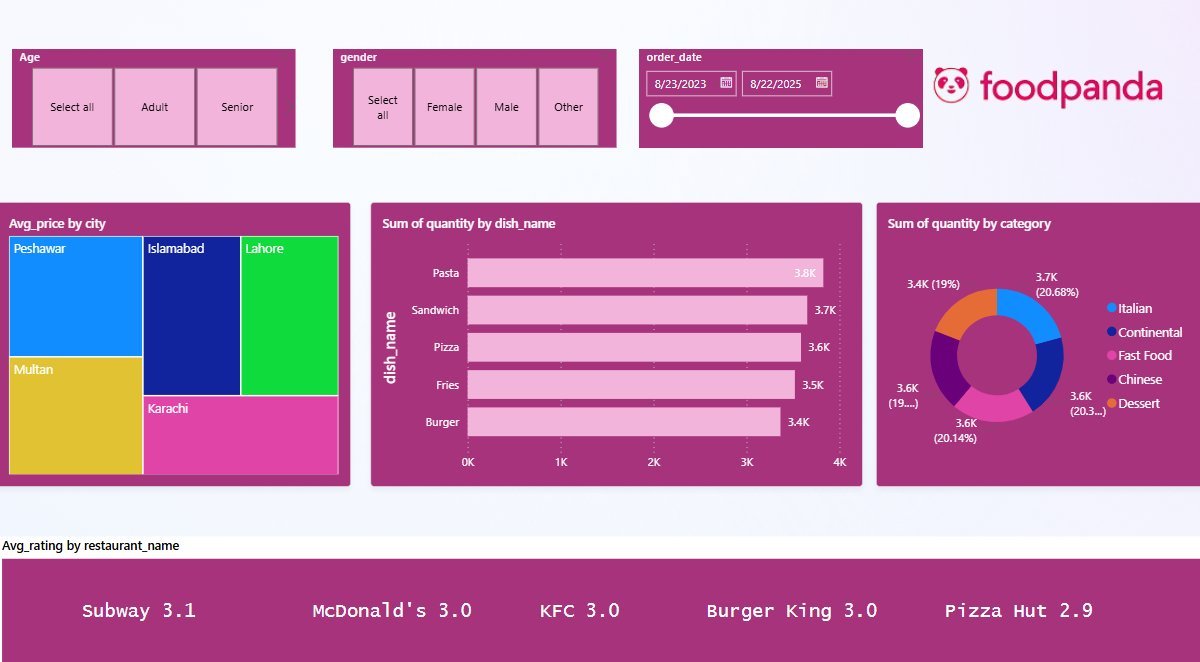
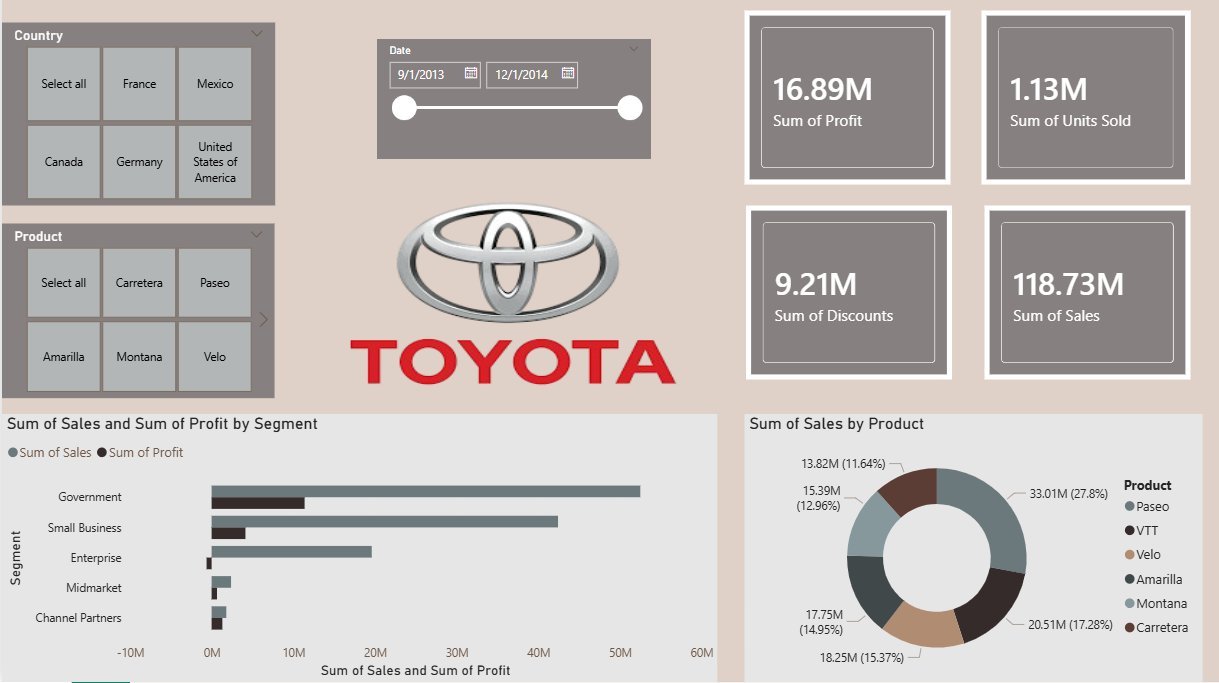
Real Power BI dashboards and data analytics projects. Click any image to enlarge or open the live dashboard.

Super Store Sales Analysis
BI & Analytics
Super Store Sales Analysis
Comprehensive Power BI report covering sales by segment, category, region, and year with interactive visuals and KPI cards.
Supreme Cars Sales Report
BI & Analytics
Supreme Cars Sales Report
Automotive sales dashboard tracking top car models by revenue, mileage, and year with dynamic year-based filtering.
Synthetic Mobile Sales
BI & Analytics
Synthetic Mobile Sales Report
Mobile brand revenue analysis by payment method, customer ratings, and brand performance across global markets.
Sales Dashboard
BI & Analytics
Sales Dashboard
Executive-level sales dashboard with $96M revenue tracking, unit sold analysis, supervisor performance, and product breakdown.
Shopping Trends Report
BI & Analytics
Shopping Trends Report
Consumer shopping behaviour dashboard with geo-mapping, payment method analysis, seasonal trends, and demographic filtering.
Amazon Sales Dashboard
BI & Analytics
Amazon Sales Dashboard
Amazon product revenue analysis with category breakdown, average ratings, yearly trends, and segment-wise performance reporting.
Foodpanda Dashboard
BI & Analytics
Foodpanda Analytics Dashboard
Food delivery analytics for Foodpanda Pakistan covering city-wise pricing, dish popularity, restaurant ratings, and demographics.
Toyota Sales Dashboard
BI & Analytics
Toyota Sales Dashboard
Global Toyota sales report with country-level filtering, product segment analysis, profit vs sales comparison, and date range slicing.
Game Console Sales
BI & Analytics
Game Console Sales Dashboard
Interactive Power BI report analyzing 1.23K units sold across Sony, Nintendo, Microsoft and more — with year-range filtering.

Need a Custom Dashboard?

Let's turn your data into powerful insights.

Get a Quote →